On a friend's insistence, I started looking into the sugar sector. I did not have much idea about the levers that drive it, and quite frankly, some of the things I uncovered while reading up were eye-opening for me too. I am sharing all of it with you through this article. It will take some time to read, but hopefully it is worth the investment.
If you would rather keep a one-page version handy, I have put everything below into a printable cheat-sheet: Download Sugar Sauce - the sugar-sector cheat-sheet (PDF).
First, a sugar company is really three businesses
This was the first thing that reframed how I look at these names. They all start from the same sugarcane, but they sell into three very different markets. The revenue mix is what separates one mill from another.
| Stream | What it is | Who buys it | Pricing power |
|---|---|---|---|
| Sugar | The core product, usually the largest revenue line | FMCG makers, wholesalers, the export market | Regulated. The government manages supply to control food inflation |
| Ethanol | Made from molasses or cane juice. The growth engine | Oil marketing companies (HPCL, BPCL, IOCL) | Weak-ish. Many producers, few buyers |
| Power | Burning bagasse, the fibrous residue left after crushing cane | The state grid and discoms | Fixed. Long-term power purchase agreements. Stable but small |
Here is the part that stuck with me. Mills poured money into ethanol not because it prints the highest margin, but because it gives them flexibility that plain sugar does not. They can point their cane at whichever product is more profitable in a given year. And because the oil marketing companies effectively set the ethanol price, the edge goes to whoever produces ethanol at the lowest cost, not whoever tries to charge the most. In this business, you cannot charge more. You can only cost less.
The four levers that drive the earnings
Once you see the three businesses, the drivers fall into four buckets. If you understand these four, you understand most of what moves the P&L.
1. Monsoon strength
Cane needs water, so the crop leans heavily on the monsoon, especially in Uttar Pradesh, Maharashtra and Karnataka. The chain runs like this: good rain leads to a high cane yield, which leads to high sugar output, which leads to lower sugar prices. A bumper crop is good for volume but pressures realisations. More is not automatically better.
2. Sugar recovery rate
This is how much sugar you actually extract per tonne of cane, and it is the single most important efficiency number for a mill (more on why later). Higher recovery means more sugar from the same cane, which means a better margin. It is driven by the time of sowing and harvesting, the gap between harvesting and crushing (shorter is better), agricultural practices, and mill efficiency. The crushing season runs roughly October to April, so recovery news clusters in those months. Timing matters: the same cane crushed late loses recovery.
3. Sugar prices
Prices are set by the balance of the production estimate versus actual output, trade policy, mill inventory levels, and festive-season demand. The important thing to internalise is that Indian sugar policy is deliberately restrictive - export caps, stock limits and the like - because the government's priority is keeping domestic food inflation down. That single fact caps how far realisations are allowed to run.
4. Government policy
This is the biggest swing factor of all, and it sits on top of everything else. The levers the government pulls are the ethanol blending target and ethanol price revisions, how much cane can be diverted to ethanol, export quotas and stockholding limits, and the regulated cane price (FRP and SAP). When the narrative here turns, the stocks move before the fundamentals do.
The words on the label: a quick glossary
A few terms come up again and again. Worth committing to memory.
| Term | Meaning | Why it matters |
|---|---|---|
| FRP | Fair and Remunerative Price, the central floor price mills must pay farmers for cane | A regulated input cost. A rise in FRP squeezes margins |
| SAP | State Advised Price. Some states (for example UP) set a cane price above FRP | Mills in SAP states carry a higher, stickier cost base |
| PPA | Power Purchase Agreement, a long-term contract to sell bagasse power to discoms | Locks in a stable but small revenue line |
| Stockholding limit | A cap on how much sugar bulk buyers or mills can hold | Tightening it curbs hoarding and supports prices |
| Bagasse | The fibrous residue left after crushing cane | Free feedstock for the power business |
One more nuance on the farmer's side, because it is easy to get wrong. Higher demand for cane and grain (maize, rice) is good for farmers, but cane prices are regulated - so farmers mostly gain stability and timely payment, not higher prices. For the mill, cane is a fixed, non-negotiable cost.
The ethanol twist: real growth, but crowded
Ethanol is the story everyone is excited about, and for good reason. But it comes with a catch that is easy to miss.
How we got here. Early ethanol blending began back in 2003-04 (Phase I). The real accelerant came later: in December 2021, under the Ethanol Blended Petrol (EBP) Programme, GST on ethanol was cut from 18% to 5%, and more feedstocks (molasses, cane juice) were allowed. That is when mills rushed to build distilleries. The biggest winners of the whole shift were the sugar companies and distilleries themselves.
Where the ethanol comes from. Not all ethanol is made from sugar. The feedstock mix roughly splits like this:
| Ethanol feedstock | Rough share |
|---|---|
| Grain-based (maize, rice) | 60-70% |
| Sugar-based (cane juice, molasses) | 30-40% |
This split matters more than it looks. If the government wants to protect sugar output in a tight year, it can lean harder on corn and rice to hit its 20% blending target, and curb the diversion of cane to ethanol. That is a policy lever pointed straight at the sugar mills.
The catch. Ethanol is growing, but there are more producers than buyers - effectively the oil marketing companies are the only customer. That caps pricing power. So again, cost leadership wins, not pricing.
Every sector has one number that matters. For sugar, it is the recovery rate
Here is a habit worth building as an investor: for any sector, find the one operating metric that best measures efficiency, and track it obsessively. It is usually not revenue or profit - it is the number underneath them.
A few examples of what I mean:
- E-commerce: GMV (gross merchandise value) and CAC (customer acquisition cost)
- Quick-service restaurants: SSS (same-store sales) and AUV (average unit volume)
- Insurance: EV (embedded value)
For a sugar mill, that number is the sugar recovery rate - the sugar extracted per tonne of cane. It is reported as gross recovery, and as net recovery after the cane diverted to ethanol is accounted for. Net recovery is the honest, comparable figure, because it captures how much sugar the mill actually kept after its ethanol choices.
I pulled the net recovery for the three names from their last two seasons of annual-report disclosures:
| Company | Net recovery, SS 2023-24 | Net recovery, SS 2024-25 |
|---|---|---|
| Balrampur Chini | 10.46% | 9.32% |
| Triveni Engineering | 10.78% | 10.13% |
| Dwarikesh Sugar | 9.79% | 8.04% |
Two things jump out. First, recovery fell across the board in SS 2024-25 - a broadly UP-wide decline blamed on red-rot disease, adverse weather and an ageing cane variety. That is a quiet margin headwind sitting underneath the share prices. Second, the gap between the companies is revealing. On a gross basis (before ethanol diversion) Triveni reported about 11.49% then 10.80%, and Dwarikesh about 11.56% then 10.96% - not far apart. But Dwarikesh's net recovery (8.04%) sits far below its gross, because it diverted heavily to cane-juice and syrup ethanol, while Triveni ran largely on the low-sacrifice route and kept its net near 10%. Same sector, very different choices, and the recovery rate is where you see it.
Now the section everyone wants to read
Now the section that everyone wants to read: stock tips. Well, these are not exactly stock tips. It is a peep into how the top sugar stocks performed in the last week and the reasons behind it. Nonetheless, it is the best way to see the four levers actually working.
Two back-to-back sessions in August 2026 showed exactly which levers were being pulled:
| Date | Move | What triggered it |
|---|---|---|
| Wed, 19 Aug 2026 | Sugar stocks up to +10% | Global raw sugar hit a 14-month high; tight domestic supply, low mill inventories, festive demand ahead, and talk of an ethanol price revision (levers 3 and 4) |
| Thu, 20 Aug 2026 | Sugar stocks up to +18% | The government tightened stockholding limits for bulk buyers (those using over 10 MT a month capped to 15 days of consumption between 1 Sep and 30 Nov 2026), and signalled possible curbs on cane-to-ethanol diversion for 2026-27 (lever 4) |
On 20 August, the gainers looked like this: Balrampur Chini +17.9%, Dwarikesh Sugar +14.7%, Bajaj Hindusthan +14.5%, Shree Renuka +7.8%, Dalmia Bharat Sugar +6.8% and Triveni Engineering +4.2%. Notice that neither day's move came from any single company's earnings. That is the signature of a sector-wide policy and price move: everything rises together, and the highest-beta names rise most. There is also a second, external lever behind the sugar price - Brazil, the world's swing producer, whose weather and cane-to-ethanol allocation drive global prices.
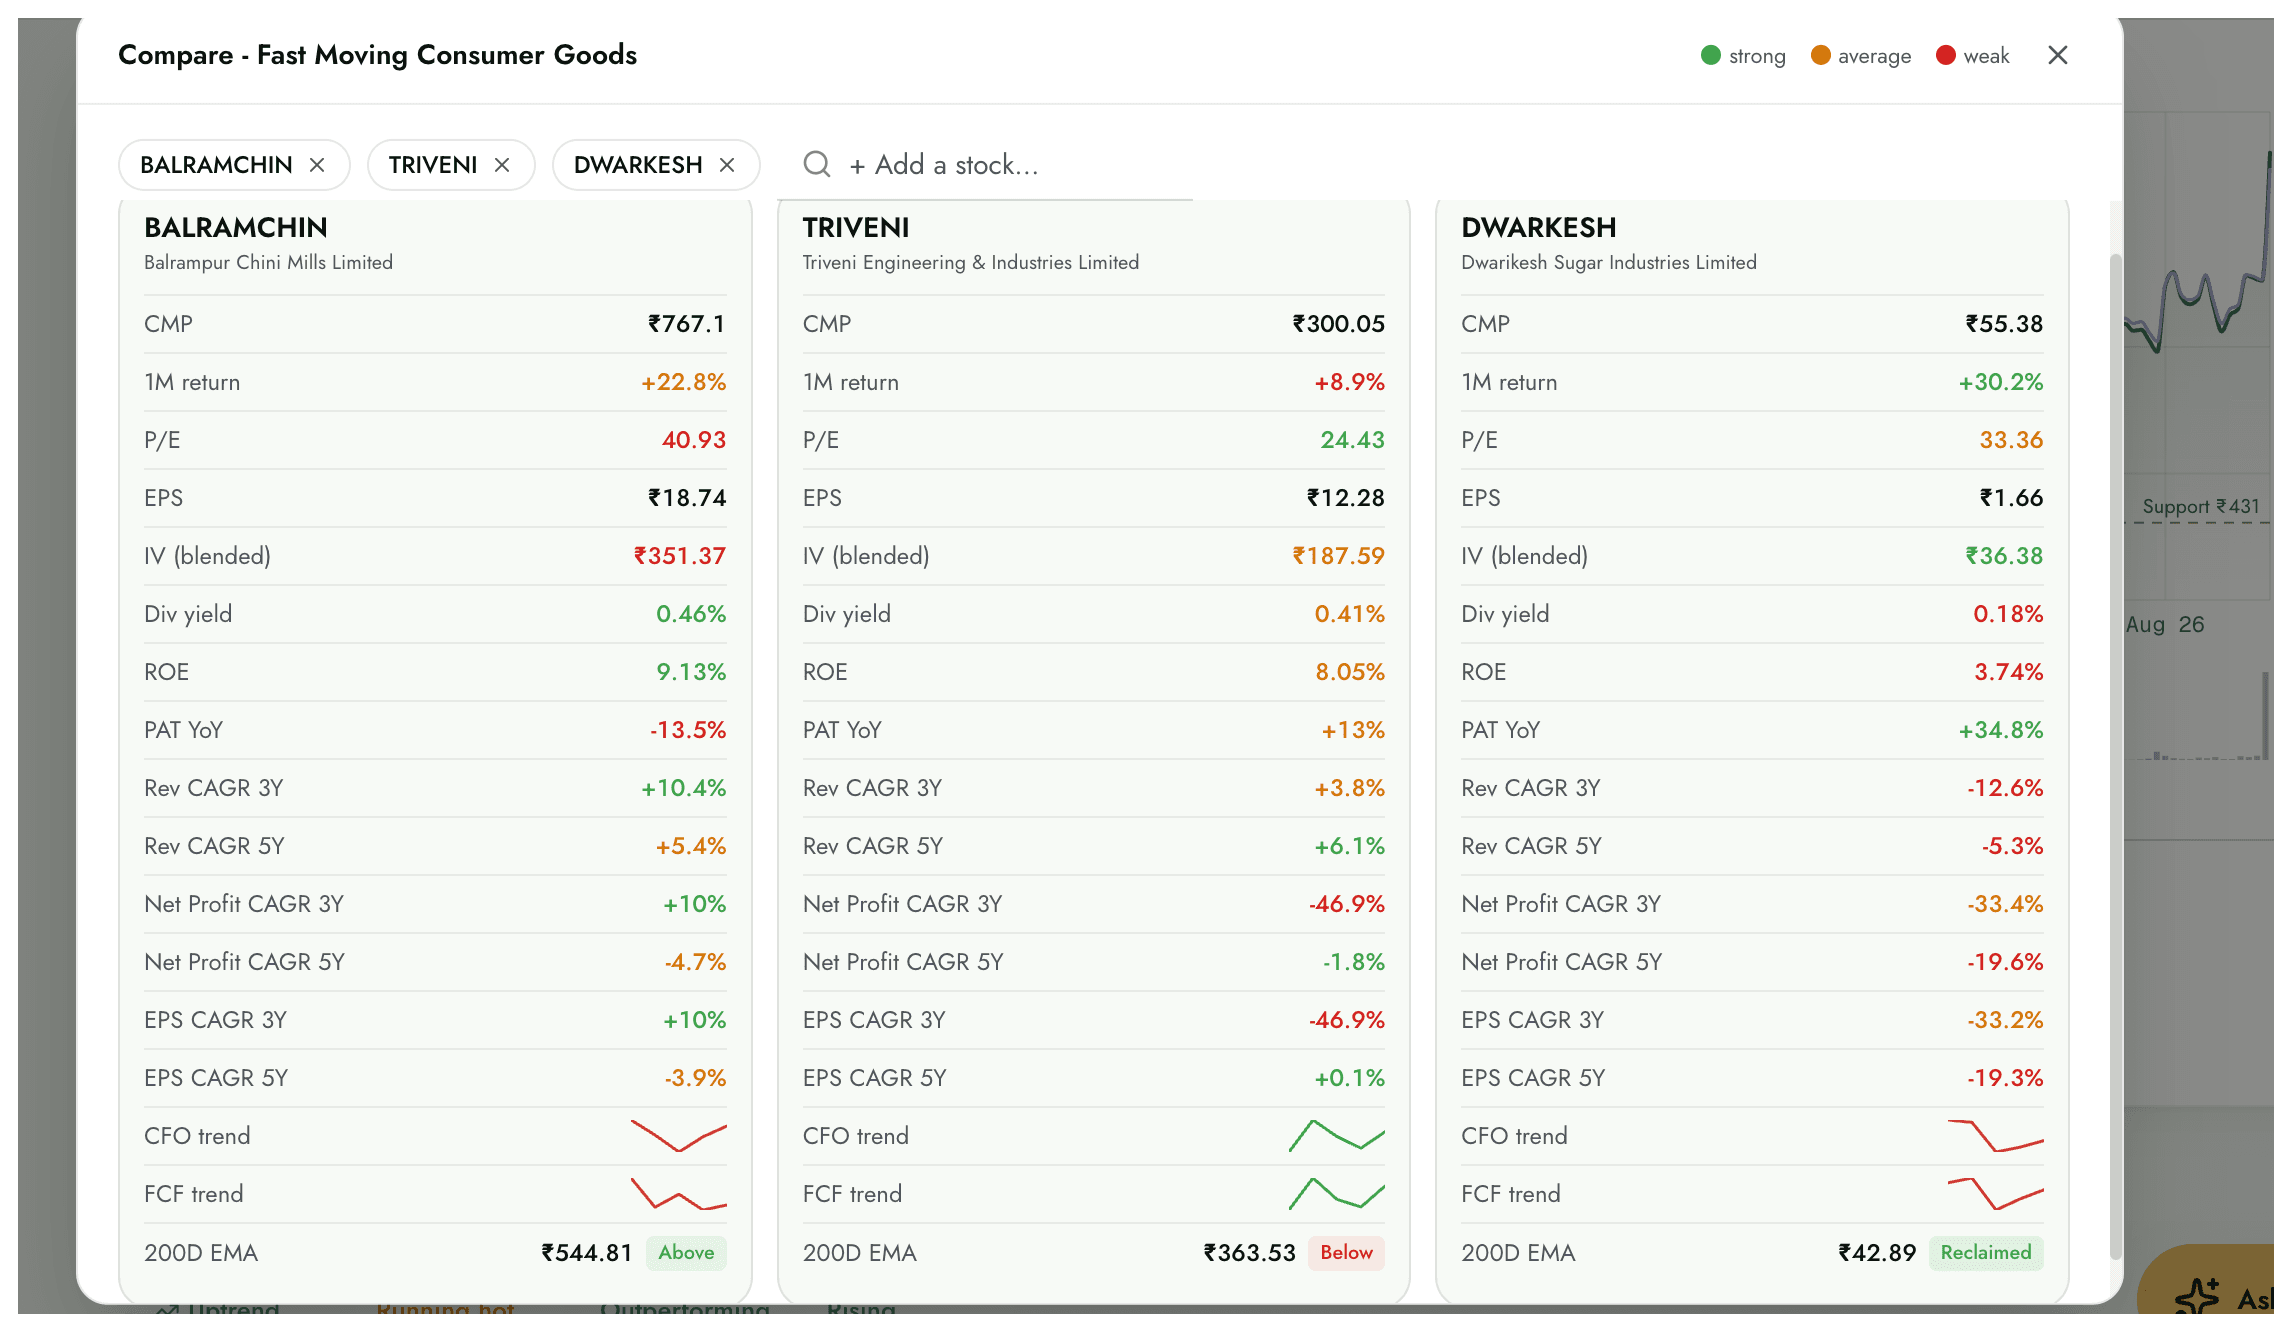
So how do the three names actually compare underneath the rally? This is the Compare view from Intrynsic, as of 20 August 2026:
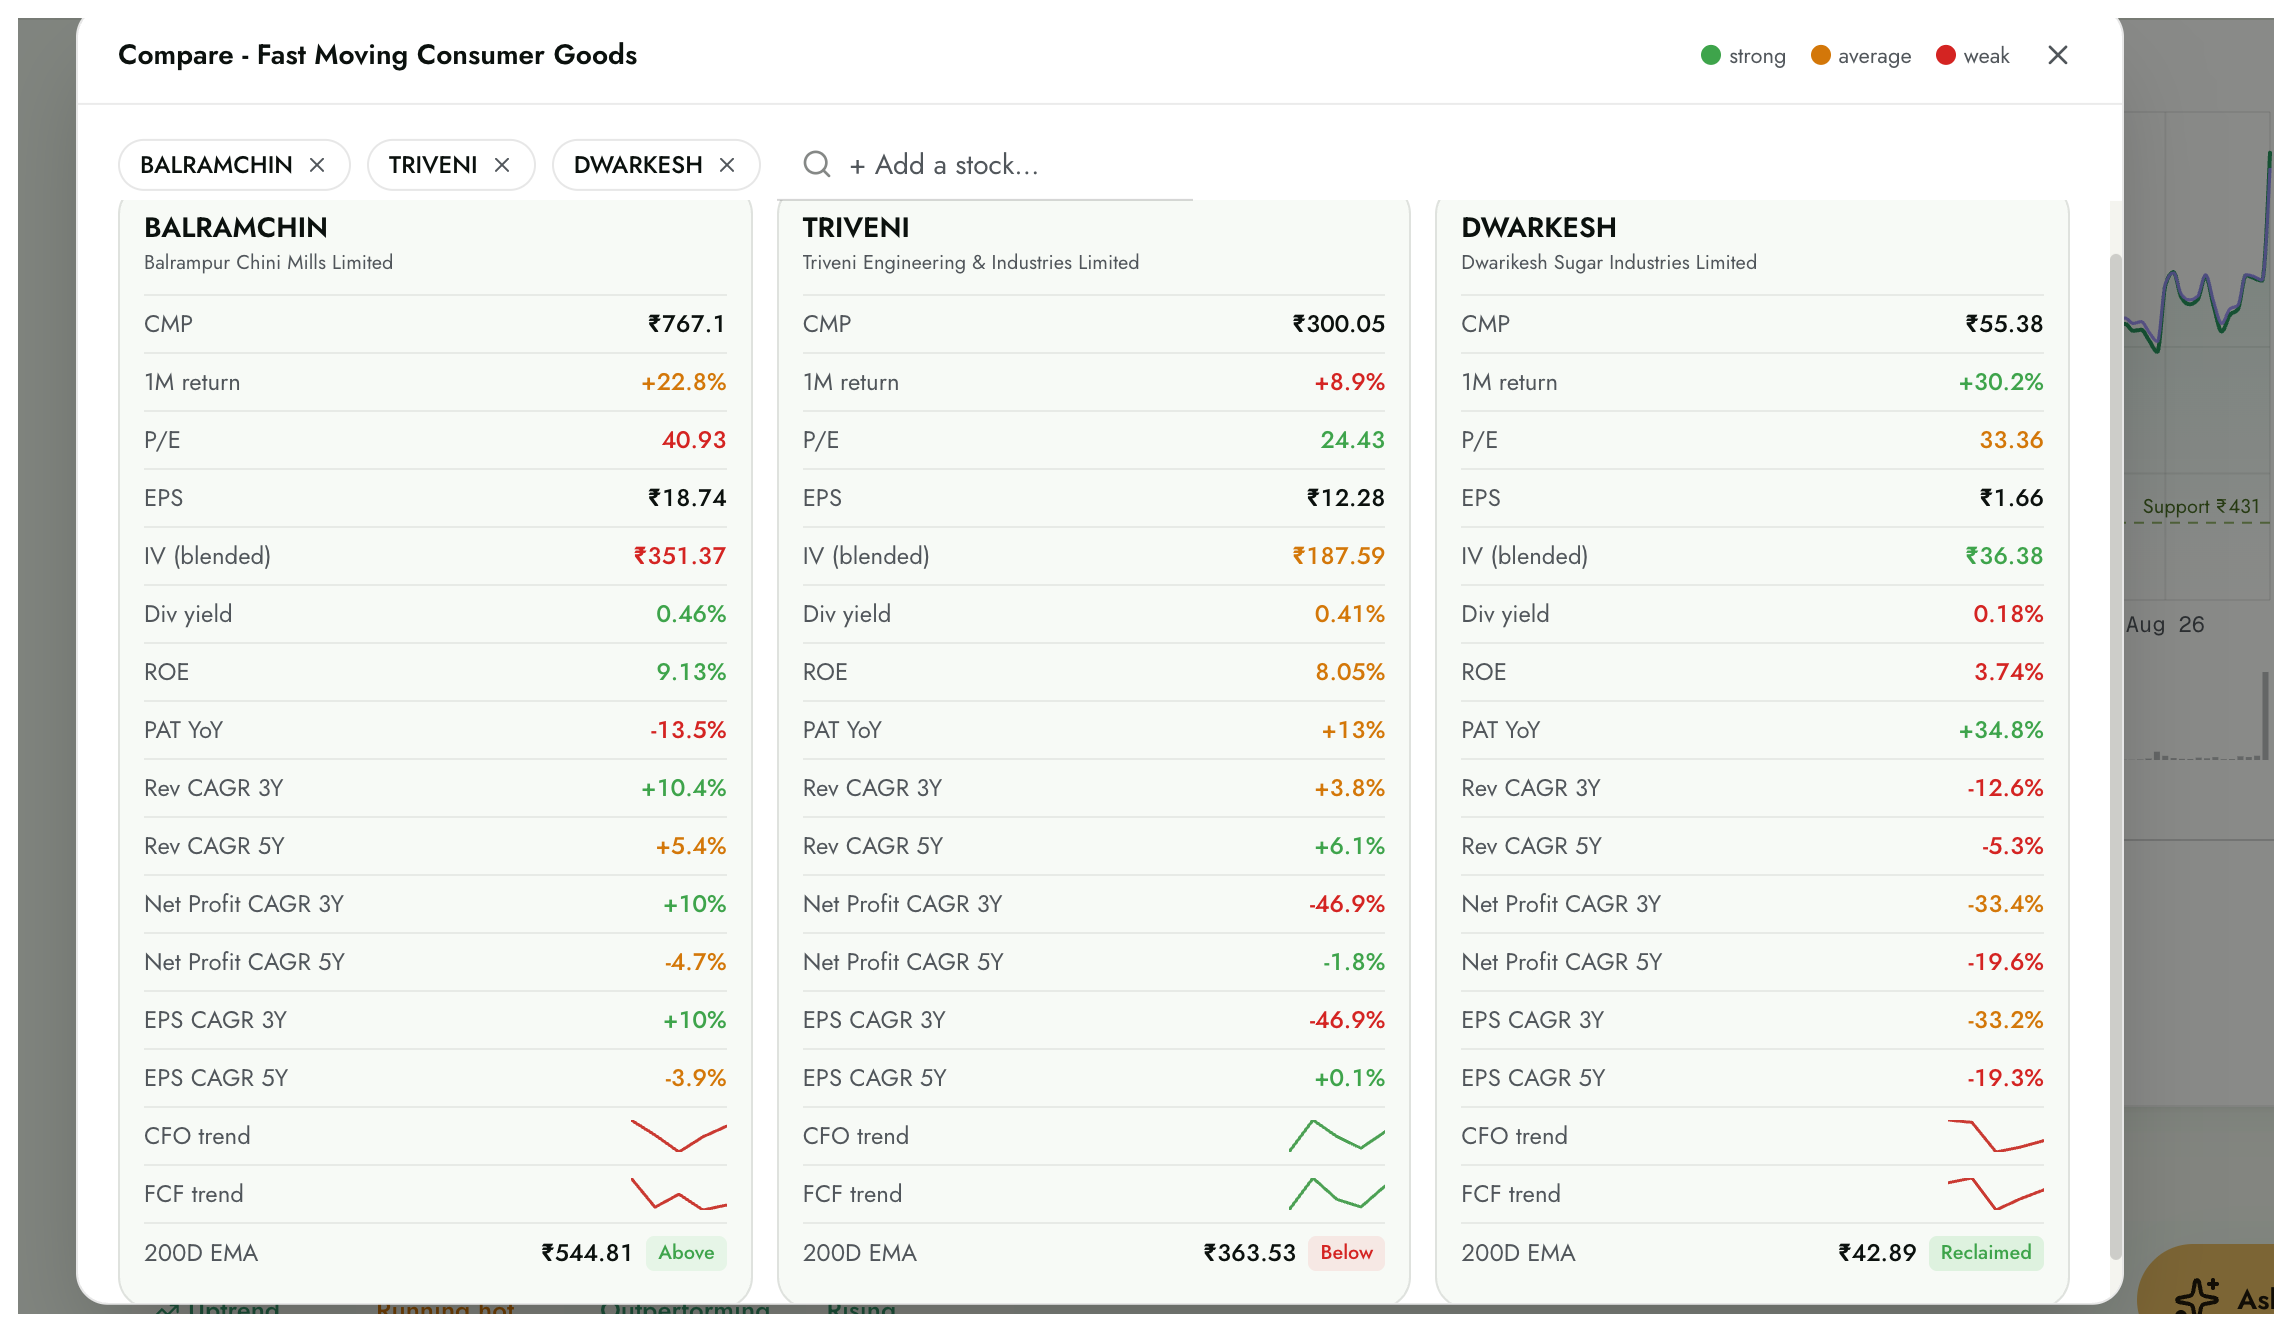
A few things stand out. Balrampur has the best growth and ROE but trades at the richest P/E and above its blended intrinsic value - quality, but priced for it. Triveni is the only one of the three with rising cash flows and the cheapest P/E, yet it sits below its 200-day EMA - value the market has not rewarded yet. Dwarikesh has the hottest one-month move on the smallest base, with the weakest ROE and shrinking profit - the classic high-beta rally name.
A footnote worth internalising here: the technicals and the fundamentals become trailing indicators when the government policy or narrative changes, positively or negatively. Positively in this case. When a stockholding limit lands on a Thursday morning, the price has already moved by the time the recovery rate, the cash-flow trend or the 200-day EMA "confirms" anything. The policy is the leading signal; the rest catches up.
My read
The sugar sector is more interesting - and more governed - than I assumed going in. There is a genuine ethanol growth story, a real efficiency lever in the recovery rate, and clear, repeatable triggers. But there is also a permanent regulatory ceiling: sugar is a politically sensitive, food-inflation-managed commodity, and the government can cap exports, change stock limits or tweak ethanol policy overnight. The upside is repeatedly trimmed by policy, and that is by design.
So my read is to understand the levers, respect the ceiling, and pay as much attention to the recovery rate and the policy calendar as to the share price. The rally tells you what happened. The four levers tell you why - and whether it can last.
If you want the compressed, printable version of all of this to keep on your desk: Download Sugar Sauce - the sugar-sector cheat-sheet (PDF).
Educational only, not investment advice. DYOR.
Sources: personal study notes on the sector; India Infoline / IIFL reports on the 19 and 20 August 2026 sugar rallies; company annual reports and season disclosures for recovery rates (Balrampur Chini, Triveni Engineering, Dwarikesh Sugar); Intrynsic Compare data as of 20 August 2026. Company names are illustrative, not recommendations.
Follow along: @tyrovirtuoso on X